Direct Mail Communications Summary - Interactions Tab
The Interactions tab on the Report Results panel on the Direct Mail Communications Summary screen is used to view the number of vehicles sold based on the type of interaction that generated the sale, such as service appointments or sales campaigns.

|
To access the Interactions tab, select the Interactions tab on the Report Results panel on the Direct Mail Communications Summary screen. |
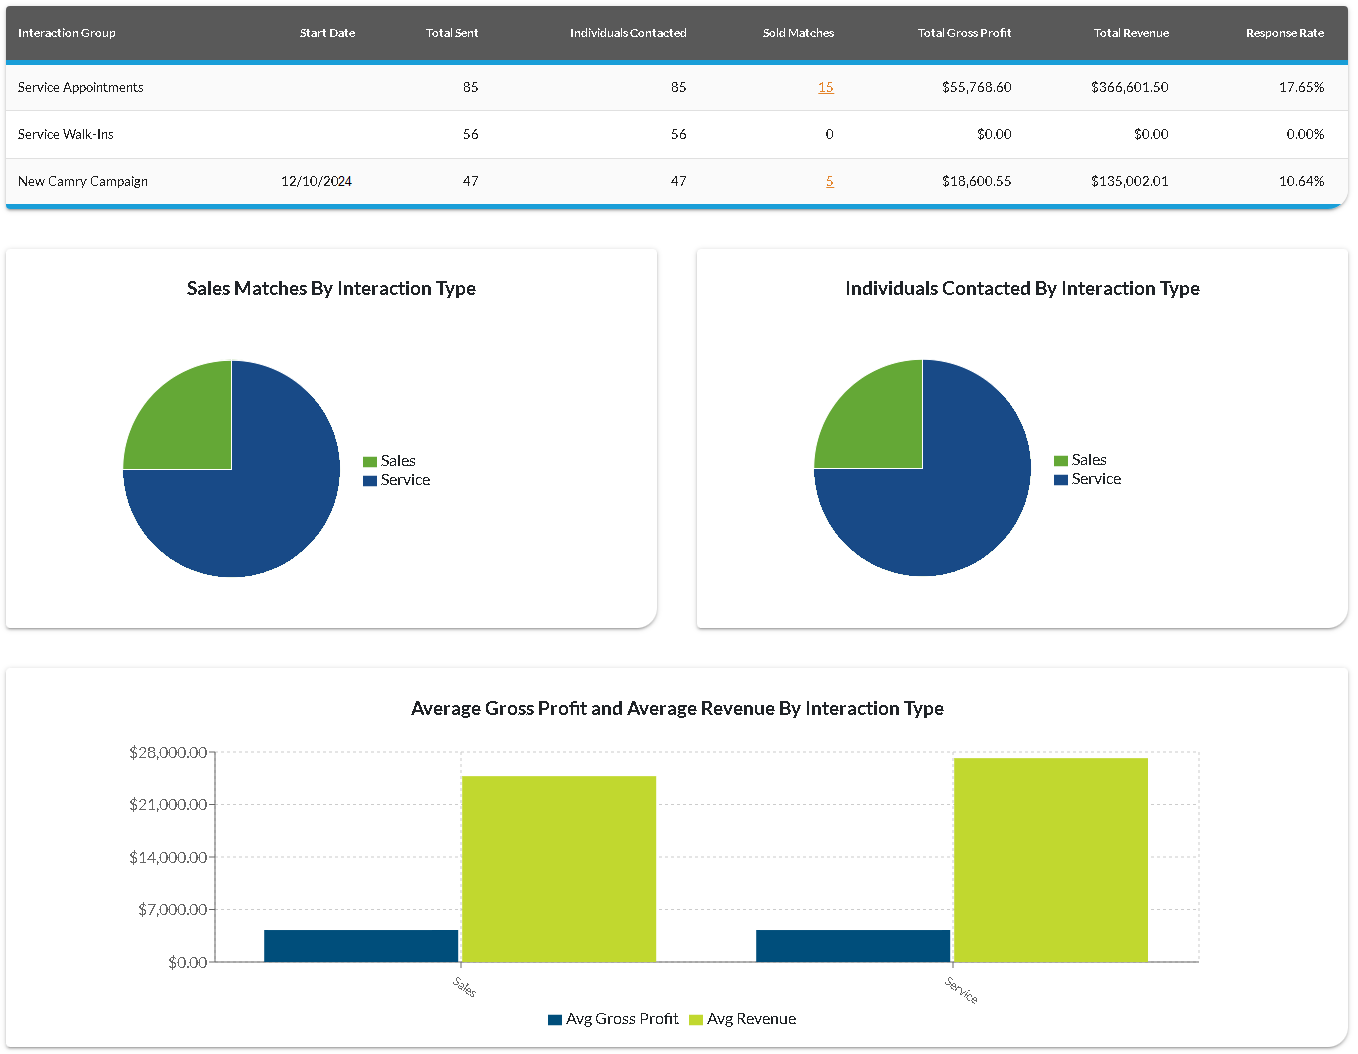
The Sales Matches By Interaction Type graph displays the number of vehicles
Note - Gross profit information only displays on this tab if the View Gross Profit check box is selected on the Report Criteria panel.
The following columns are available on the Interactions tab.
Interaction Group: The type of customer interaction associated with the
Start Date: The date on which the sales campaign began displays.
Total Sent: The number of direct mail pieces sent
Individuals Contacted: The number of prospects to which direct mail was sent
Sold Matches: (Link) The number of sold matches associated with the corresponding interaction group during the entered date range displays. Click this link to display the Detailed Results window, where details of the transactions can be reviewed.
Total Gross
Total Revenue: The revenue generated from sold matches associated with the corresponding interaction group during the entered date range displays.
Response Rate: The percentage of interactions that resulted in sold matches displays.
Click here for a list of products that may be mentioned in this help file.